
UX and design system – annual global research initiative
Growing user trust, participation, and collaboration.
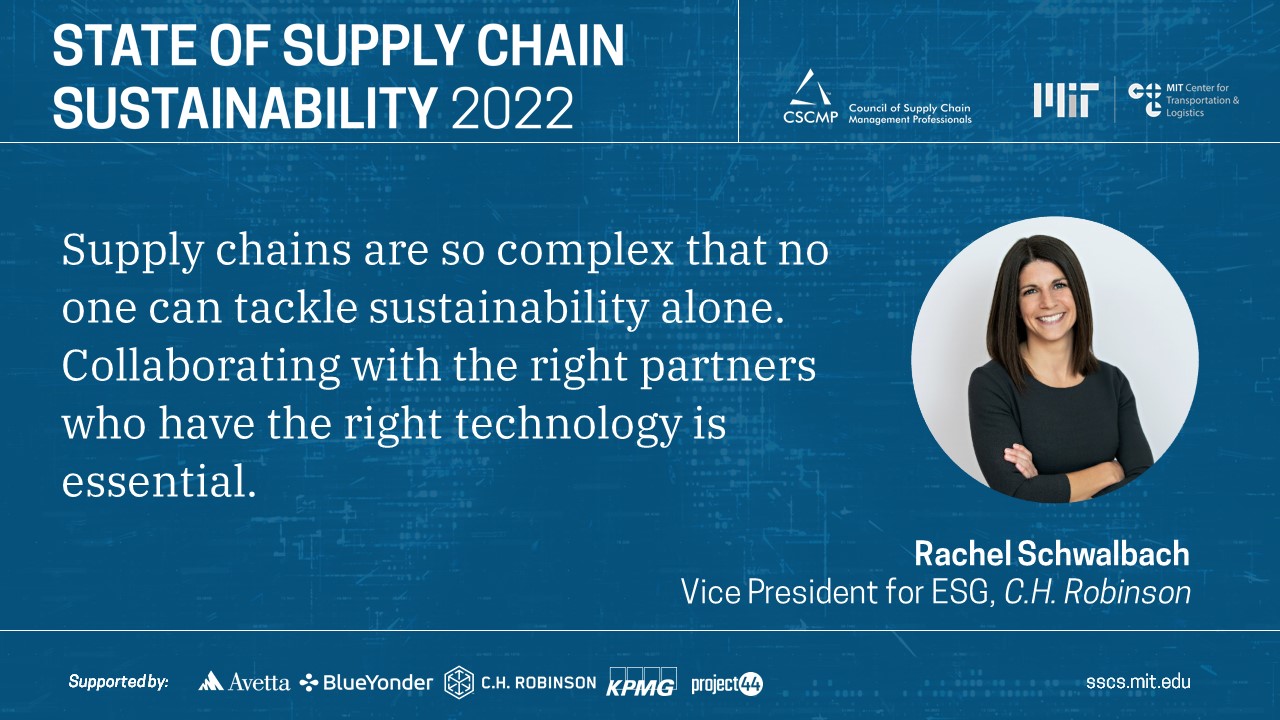
The State of Supply Chain Sustainability research effort and report spanned four years, with a 50% growth in engagement and downloads each year. Our strategy leveraged our sponsor network and social media influencers (primarily LinkedIn) under the slogan, “There is no sustainability without supply chain sustainability.”
Through survey and interview design, interactive website design, press releases, webinars, events, influencer engagement, and selected sponsor engagement, we successfully permeated our message to supply chain practitioners globally to achieve survey results and ultimately drive downloads of the final product each year. The report has been featured in 100s of publications, from the World Economic Forum to the Wall Street Journal.
Arthur served as the art director and product manager for a team of six. Annually from October to December, we collaborated on the survey and user interview process design and produced the interactive website, webinars, and paid digital, email, and social media research outreach. Research scientists compiled results and critical findings from December to April. Our team edited and advised on the storytelling. We produced the digital downloads, accompanying website, outreach events, and social campaigns from April through September.
With this process, we iteratively crafted a design system for the publication, website, marketing, and publicity. The design system maintained thematic continuity year to year while allowing for distinctive features for any given year. Colors and elemental themes rotated through the years. This system was translated from Figma and Adobe to common MS Office suite tools to ensure its longevity regardless of future product owners’ design or technical know-how. Print, web, and social media utilized the Tableau design system alongside art created in Illustrator and Figma.
Visit the report website.
Stakeholders
Research institute team.
Role
Digital product owner, art director, production & project manager.
Collaborators
Executive leadership, research team, design, engineering, & events teams, contractors.
Methods
- User interviews
- Personas
- Data mining
- Cluster analysis
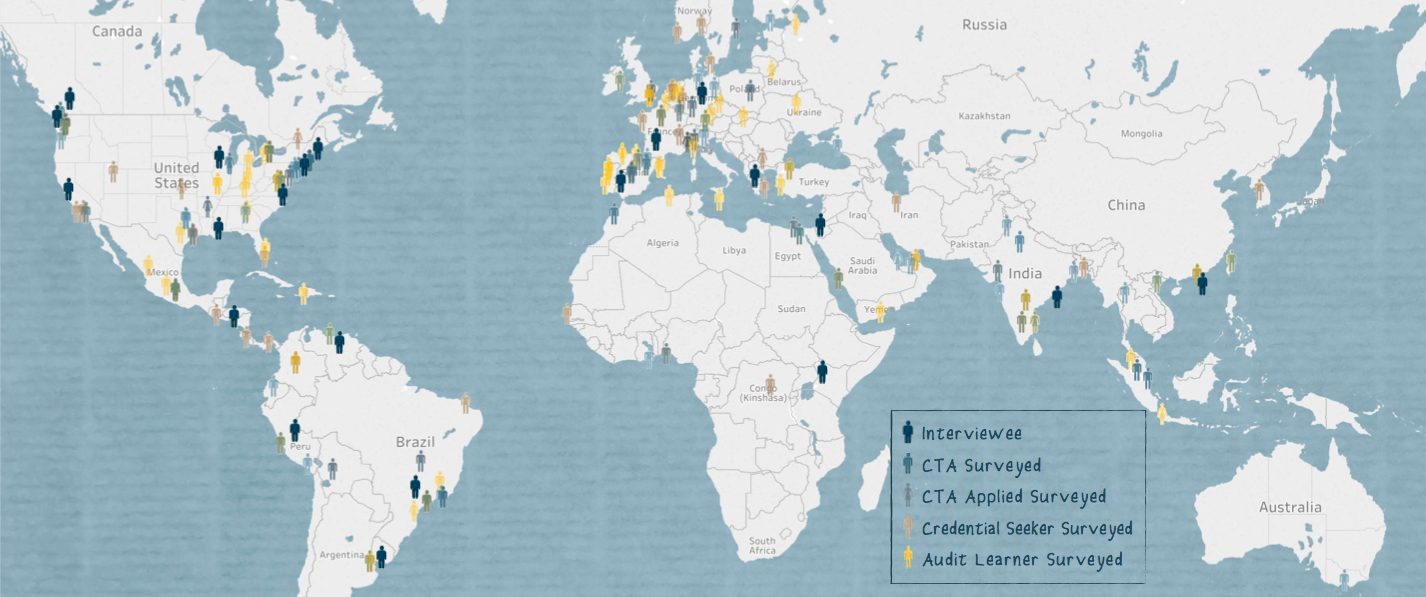
- Global survey
- Longitudinal survey
- Rapid prototyping
- Wireframes
- Design systems
- Graphic design
Software
Adobe Creative Suite–Illustrator, Indesign, Photoshop; Tableau; Qualtrics; WordPress; Salesforce.
Design System
PDF Downloadable


Interactive Website


Design System Previous Years
Document design and data visualization


Event promotional

Social media campaign elements

Social media campaign sample performance

Earlier Design Iterations


Infographic


More Cases

Zero Trust SecOps service design
Reducing risk at U.S. Centers for Medicare and MedicaidOutcomesBonus...
User-centered product strategy
Doubled new leads + 10x engagement at MIT OutcomesCase Context The client...
Gratitude_x – How gift economy influences learner attitudes in a massive open online course
Abstract Massive Open Online Courses or MOOCs have grown in membership...